| Boyd's World-> A 25-Year Retrospective -- 1995-2019 | About the author, Boyd Nation |
A 25-Year Retrospective -- 1995-2019
This is the sort of article that would definitely be broken up into chunks on a more commercial site, but I like it as a long read to be gone through at leisure, so I'm leaving it as one. I do realize that, having read it, you may want to jump back to individual sections, though, so here's a Table of Contents of internal links so you can jump to your part on later visits.
With my recent completion of gathering full(ish) score sets for the 1995 and 1996 seasons and the finalization of the 2019 season, it seems like a good time to look back at the quarter century of data that this gives us. I know that 2019 doesn't scratch the itch for round numbers, but it's what we've got for now; nudge me after 2025, and I'll take another shot at it.
In the big picture, you can make the case that this is just a narrow slice. After all, the first intercollegiate baseball game that we know of took place in 1859, so we're talking about around 15% of the seasons in history. From that perspective, for example, the Northeast has been the dominant region of the country for far longer than any other, since that would run from that 1859 beginning to at least 1920 and arguably 1930, I suspect, which makes this little SEC thing just a blip on the radar.
From a big picture narrative point of view, though, I suspect this last quarter century will stand out a bit in history. The biggest reasons for that are the intertwined growth accelerators of money and TV. If my occasionally imperfect memory is correct, the only nationally televised game that you could have watched during that 1995 season was the Cal State Fullerton-Southern California CWS final game. To the best of my knowledge, there weren't any regional broadcasts, other than perhaps a few hyper-local single market games. This year, of course, there were fans of at least a couple dozen teams that were vaguely irritated because they still can't watch some of the Tuesday night games, since they get all the others.
Correspondingly, and serving as both cause and effect, money has entered the game, unevenly and sporadically but in ways that have definitely changed the game. There were no baseball programs that made money in 1995, although the two highest-attendance SEC teams were getting close. Financially, the game was down in the supported-by-football-and-basketball weeds with rowing and cross country. Now, it's certainly not the case in 2019 that the majority of D1 programs are self-sustaining - that's still rare outside the power conferences, which is one of the things that leading to the increasing gap we're seeing between the big boys and everyone else - but the big boys are bringing in enough money to have the self-determination that goes financial self-sufficiency and to have the ability to experiment with different approaches to recruiting and player development.
As an example, the first time I researched it, in 2003, there were a very small handful of coaches (probably only two) who were topping $300,000 in total compensation. This year, the overwhelming majority of the SEC and Pac-12 coaches are over $500K in salary, and around half are clearing a million in total compensation. Similarly, any SEC or Pac-12 programs that aren't running in the black are doing so because they've participated in the facilities arms race, which they do as a form of investment in future profits.
That leads us to this interesting point in time. There are tons of resources available now to a large number of programs, and some of them are taking advantage of those resources to an extent, with training facilities and easier travel as the primary beneficiaries. Cheap travel has also changed the game heavily, as we'll discuss in a moment. The two major ways that money could change the game, though, player recruitment and coaching investment, are being throttled by NCAA limits on scholarships and staff sizes. I think that's the most likely area that we'll see significant changes in during the next 25 years; the pressure to realign those numbers with the current state of the game is growing rapidly, and I think we'll see changes within the next five years or so. Now, it's traditional to blame the current set of numbers on Title IX, and that's certainly where it started, but, as Rick Cleveland pointed out in his excellent piece about Jake Mangum's comments at the CWS, you could easily balance the books by taking six scholarships from football and three from basketball without damaging those sports or affecting women's sports in any way. That's one solution, but given the increased revenue numbers across the board, you could also do it by just adding to the overall scholarship numbers in baseball and softball, for example.
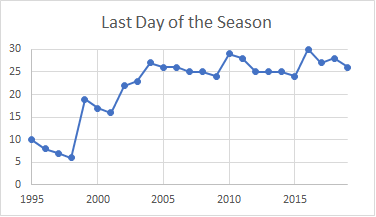
Now, despite the fact that I'm six paragraphs in, narrative isn't really what I do here, so let me give you a graph that sort of explains another trend that we're already seeing that I think will accelerate.
The Y axis here is the day of the month in June when the last game of the CWS was played for that particular year. It's a little thing, but it ties to a big thing, which I'll get to in a roundabout way. In 1935, the first serious proposal for a College World Series was floated. The reason that it floundered was one that shaped the game for at least three-quarters of a century, and it's an extremely simple one: The logical time for a college baseball season is different in different parts of this rather large country. In 1935, the traditional powers in the north were winding down their season in late June, since they hadn't been able to start practicing until April, so that was assumed to be when the tournament would be played. However, the rising powers in the south and California had already wrapped up and gone home by mid-May, because it was too hot for any sane person to be playing baseball. It took until 1947 for the tournament to come together, and the compromise on dates that was made then eventually (once the game grew to the point where longer seasons were desired than could be fit into April and May) formed the game so that southern and western teams became dominant. This was more due to a budget-based desire to finish the season with the school year rather than an intent to favor the warmer areas of the country, but the effect was the same either way.
Note, though, the graph above; for about fifteen years now, we've been playing on the northern schedule. Now, the long season does mean that what we have is basically a southern start date with a northern end date, but that does at least potentially put the two groups on a long-term equal footing. You can't draw a direct causal line from that graph to the fact that Michigan played for the title this year or to more important things like recent top 10 seasons by Indiana and Purdue, but I believe we're seeing the front edges of a wave. Change takes time - it took about a decade from the facilities investments in Starkville and Baton Rouge until the first SEC title in 1990 and another 15 years for the SEC to really become one of the two dominant leagues in the game - and you can date the beginnings of a facilities investment boom in the Big 10 to around 2008, so I think we're going to be seeing continuing signs of this balance improving.
That leads to one other change in the game I want to mention - the game as a whole is better connected than it used to be. For this, we'll go with a hard-core analytic measure: For every pair of teams in Division 1, what's the average shortest distance of a path on the games network between them? Fortunately, this one translates well to English - if Enormous State University played St. Gutniss the Obstinate, and St. Gutniss played STEM Tech and Lawn Mower Repair, and STEM Tech played Vine-Covered U., then that's a path of length 3 between ESU and VCU. If that turns out to be the shortest path, that 3 is what we'll count in our average. Here are the numbers:
|
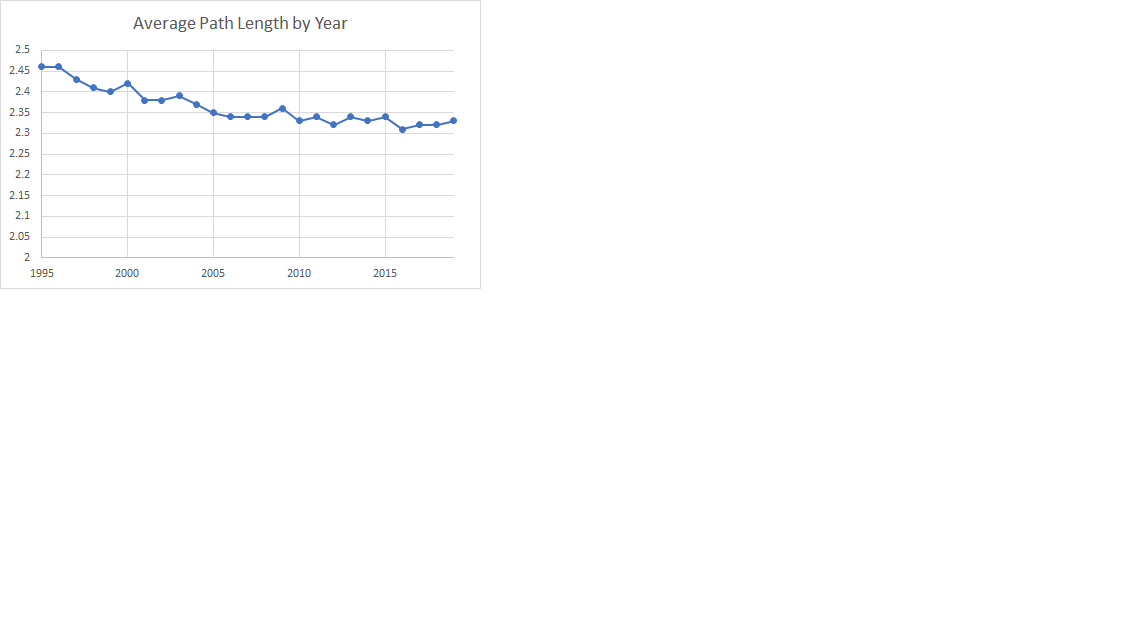 |
As you can see, there was about a 6-7% decrease in this average path length. Most of that happened between 1995 and 2005. It turns out that the area that this average length falls into is kind of a big deal due to the tools that they use. Because the RPI doesn't look at any chains further out than two games (the OOWP factor), it has no chance at comparing teams that are farther apart than that. Reducing the number of pairs of teams beyond that range has improved the performance of the RPI (to be clear, that's an accidental result, even if it's a fortunate one) - if you look at the difference in the RPI and the ISR, it's much more marked in the early years.
The Best
We'll start with an easy one. Who's been the best team? I dunno (so much for easy); what do you mean by best? We'll use highest average ISR as a proxy; you can defend that definition as easily as any, and it's easy to compute. There were 242 teams that played in all 25 of the seasons in question; here are the top 25 by average ISR (the full list is here):
| # | Average ISR |
Team |
| 1 | 121.5 | Cal State Fullerton |
| 2 | 120.7 | Stanford |
| 3 | 120.0 | Florida State |
| 4 | 119.8 | Louisiana State |
| 5 | 119.1 | Arizona State |
| 6 | 117.8 | Rice |
| 7 | 117.7 | Miami, Florida |
| 8 | 117.7 | Florida |
| 9 | 117.5 | Texas |
| 10 | 117.0 | Oregon State |
| 11 | 116.8 | UCLA |
| 12 | 116.4 | Clemson |
| 13 | 116.3 | Texas A&M |
| 14 | 116.2 | South Carolina |
| 15 | 116.2 | Arkansas |
| 16 | 116.0 | North Carolina |
| 17 | 115.5 | Southern California |
| 18 | 115.1 | Georgia Tech |
| 19 | 115.0 | Long Beach State |
| 20 | 114.8 | Mississippi |
| 21 | 114.6 | Vanderbilt |
| 22 | 114.4 | Oklahoma State |
| 23 | 114.4 | Mississippi State |
| 24 | 114.4 | Texas Tech |
| 25 | 114.3 | Arizona |
All right, then who had the single best year? I played around with some more complicated measures like standard deviations abouve the mean, but it turns out that those just give you a more complicated version of the same answers. Here, then, are the #1 ISR teams who left the biggest gap above the #2 for that year:
| # | Year | ISR Gap | Team |
| 1 | 1995 | 7.9 | Cal State Fullerton |
| 2 | 2017 | 6.0 | Oregon State |
| 3 | 2012 | 3.2 | UCLA |
| 4 | 2018 | 2.7 | Oregon State |
| 5 | 2010 | 2.6 | Arizona State |
| 6 | 2006 | 2.4 | Cal State Fullerton |
| 7 | 1997 | 2.0 | Louisiana State |
| 8 | 2011 | 2.0 | Vanderbilt |
| 9 | 2008 | 1.6 | Arizona State |
| 10 | 2019 | 1.1 | Vanderbilt |
I wanted to come up with a measure for best class, so I looked at the best teams for three-year spans. It turns out that you get a lot of overlapping periods doing that, so it's likely that the best model is not one of specific classes but of dynasties of varying length, where success on the field feeds into recruiting success. Nonetheless, here are the best three-year periods:
| # | Years | Overlapping Years |
Average ISR |
Team |
| 1 | 1995-1997 | 128.8 | Cal State Fullerton | |
| 2 | 2008-2010 | 128.6 | Arizona State | |
| 2009-2011 | 127.8 | Arizona State | ||
| 2010-2012 | 125.6 | Arizona State | ||
| 2007-2009 | 125.4 | Arizona State | ||
| 3 | 1995-1997 | 127.5 | Southern California | |
| 1996-1998 | 126.5 | Southern California | ||
| 4 | 1996-1998 | 126.4 | Louisiana State | |
| 1995-1997 | 126.3 | Louisiana State | ||
| 5 | 2001-2003 | 125.9 | Stanford | |
| 1999-2001 | 125.8 | Stanford | ||
| 2002-2004 | 125.8 | Stanford | ||
| 2000-2002 | 125.7 | Stanford | ||
| 6 | 1998-2000 | 125.6 | Stanford | |
| 1996-1998 | 125.4 | Stanford | ||
| 1997-1999 | 125.0 | Stanford | ||
| 7 | 2017-2019 | 125.6 | Oregon State | |
| 2016-2018 | 124.5 | Oregon State | ||
| 8 | 2010-2012 | 125.5 | UCLA | |
| 2011-2013 | 123.7 | UCLA | ||
| 9 | 2008-2010 | 125.3 | Cal State Fullerton | |
| 2009-2011 | 124.7 | Cal State Fullerton | ||
| 10 | 2002-2004 | 125.2 | Texas | |
| 2003-2005 | 124.9 | Texas | ||
| 2004-2006 | 123.6 | Texas |
Here's another interesting question: Who's been the most consistent? This isn't necessarily a sign of greatness; you can be consistently bad, after all (although that's not how it tends to work out, in real life). It does have some value for your opponents in scheduling, though; one of the big risks in putting together a smart schedule comes when you think a team is going to go .580 and they actually come in at .420. With that in mind, here are the teams with the lowest standard deviation to their ISR over this quarter-century:
| # | Standard Deviation |
Team |
| 1 | 2.99 | Florida State |
| 2 | 3.73 | Texas-San Antonio |
| 3 | 3.79 | Alabama-Birmingham |
| 4 | 3.81 | California |
| 5 | 3.83 | Tennessee-Martin |
| 6 | 3.91 | Georgia State |
| 7 | 3.98 | Eastern Kentucky |
| 8 | 3.99 | Mississippi |
| 9 | 4.01 | Georgia Tech |
| 10 | 4.13 | Southern Mississippi |
| 11 | 4.14 | Georgia Southern |
| 12 | 4.15 | Western Illinois |
| 13 | 4.17 | Murray State |
| 14 | 4.22 | Kent State |
| 15 | 4.30 | Jackson State |
| 16 | 4.31 | North Carolina State |
| 17 | 4.32 | Ohio State |
| 18 | 4.33 | Maine |
| 19 | 4.33 | Oklahoma State |
| 20 | 4.38 | Texas State |
| 21 | 4.42 | Siena |
| 22 | 4.47 | Furman |
| 23 | 4.49 | Oklahoma |
| 24 | 4.51 | Southern Illinois |
| 25 | 4.51 | Loyola Marymount |
One can theorize, then, without being able to prove, that this may play into Florida State's status as one of the best teams without a title - on average, they've been one of the best, but they haven't gone much above (or below) that baseline.
For contrast, here are the least consistent. As you can tell, this one's an interesting mix of good and bad teams, although most of those you think of as good were bad for ten years and good for ten, rather than ping-ponging around.
| # | Standard Deviation |
Team |
| 242 | 11.87 | Canisius |
| 241 | 11.29 | Alabama State |
| 240 | 11.08 | Manhattan |
| 239 | 9.94 | Delaware State |
| 238 | 9.75 | Louisville |
| 237 | 8.72 | Columbia |
| 236 | 8.42 | Florida A&M |
| 235 | 8.24 | Southern |
| 234 | 8.23 | Richmond |
| 233 | 8.20 | Coastal Carolina |
| 232 | 8.16 | Vanderbilt |
| 231 | 8.00 | Holy Cross |
| 230 | 7.94 | Prairie View A&M |
| 229 | 7.91 | Texas-Rio Grande Valley |
| 228 | 7.80 | Indiana |
| 227 | 7.69 | Santa Clara |
| 226 | 7.68 | Tennessee Tech |
| 225 | 7.67 | Old Dominion |
| 224 | 7.65 | Lafayette |
| 223 | 7.58 | Wright State |
| 222 | 7.50 | Rhode Island |
| 221 | 7.47 | Southern California |
| 220 | 7.44 | Virginia |
| 219 | 7.38 | Appalachian State |
| 218 | 7.36 | The Citadel |
Now, all of these to date have been based around those 242 teams who were in D1 for the full 25 years. The bulk of the additions during that time have hung around toward the middle or bottom of the list; they're schools that decided to move to D1 for the basketball money but haven't had a huge impact on baseball. There have been a few, though, so here are the top 25 programs that joined D1 during this time:
| # | Average ISR |
Years in D1 |
Team |
| 1 | 114.4 | 18 | UC Irvine |
| 2 | 113.6 | 11 | Oregon |
| 3 | 111.1 | 16 | Dallas Baptist |
| 4 | 107.7 | 18 | UC Riverside |
| 5 | 105.3 | 5 | Birmingham-Southern |
| 6 | 105.2 | 12 | Florida Gulf Coast |
| 7 | 104.2 | 24 | North Carolina-Wilmington |
| 8 | 103.6 | 6 | Grand Canyon |
| 9 | 103.3 | 22 | Elon |
| 10 | 102.8 | 14 | North Florida |
| 11 | 102.1 | 15 | UC Davis |
| 12 | 101.5 | 24 | North Carolina-Greensboro |
| 13 | 101.3 | 14 | Kennesaw State |
| 14 | 101.2 | 13 | Central Arkansas |
| 15 | 101.1 | 23 | New Orleans |
| 16 | 100.9 | 24 | Jacksonville State |
| 17 | 100.7 | 11 | CSU Bakersfield |
| 18 | 99.9 | 11 | Bryant |
| 19 | 99.4 | 24 | Southeast Missouri State |
| 20 | 98.5 | 22 | Belmont |
| 21 | 98.3 | 20 | Texas A&M-Corpus Christi |
| 22 | 97.5 | 17 | Gardner-Webb |
| 23 | 97.2 | 15 | Stephen F. Austin State |
| 24 | 97.0 | 18 | Lipscomb |
| 25 | 96.9 | 20 | Stony Brook |
There are no national titles on this list, but UC Irvine has been to Omaha and Oregon hosted a super, and it wouldn't have been shocking if either of them had won one. The six years for GCU mark their return to D1. And then there's Birmingham-Southern, who is also going to show up on the next list; the attempt to move to being the smallest D1 school almost bankrupted the university, but I do miss what the baseball team did in that short window. I left out Cal Baptist from this list, but 2019 was an impressive debut season for them; they would be tied with BSC if I had included them.
Finally, for this section, let's pour one out for the fallen. Here are the programs who left D1 during this 25 years with the highest average ISR:
| # | Average ISR |
Years in D1 |
Team |
| 1 | 105.3 | 5 | Birmingham-Southern |
| 2 | 102.6 | 7 | Iowa State |
| 3 | 101.7 | 5 | Providence |
| 4 | 100.6 | 15 | Northern Iowa |
| 5 | 98.3 | 2 | Wyoming |
| 6 | 95.2 | 4 | Portland State |
| 7 | 94.0 | 16 | LeMoyne |
| 8 | 92.9 | 16 | Centenary |
| 9 | 92.6 | 14 | Hawaii-Hilo |
| 10 | 92.3 | 18 | Southern Utah |
Postseason Selections
As those of you who have been around for a while know, I don't care that much about the postseason, at least as far as analysis goes. I'm human and therefore emotional, of course, and I'll rejoice if my team ever wins one, but I know enough to know that baseball is the wrong sport to follow if you're expecting the best team to actually win any sort of postseason format that will fit in the time allowed by reality. With that said, it would be nice if we at least gave the teams that have performed the best a better chance to win whatever format we came up with.
With that in mind, I've put together a methodology for measuring how well a team is treated by their selection (or nonselection, of course) in a given year. Using the ISR at selection time, you can lay out a "perfect" field, taking the automatic bid teams, filling in the highest remaining ISR teams, laying them out 1 to 64, and building a bracket accordingly. This, of course, would require the committee to ignore several unwritten rules and at least two written rules - the silly ones involving not pairing conference opponents in a regional (although changing that wouldn't shift off the ideal by much) and the one requiring over .500 records. You can then use the ISR-based probabilities to compute how likely it "should" have been that a team would win the title and compare that to how likely they were to win the actual field to see how abused they were for that year. With that in mind, here are the most abused teams for the last quarter century.
Well, almost. Although my focus for this piece is 25 years, there was a format change in 1999 that complicates things. It's not that it would be difficult to compute the odds for the 48-team field; it's that that field was always indeterminate - they didn't seed the CWS field until it was known after the regionals. So these results are for the 1999-2019 period.
| Team | Reduced Probability of CWS Visits |
Reduced Probability (in Championships) |
| Stanford | -0.8186 | -0.3752 |
| Long Beach State | -0.2643 | -0.1055 |
| Cal State Fullerton | -0.2124 | -0.0973 |
| Arizona | -0.2542 | -0.0957 |
| Southern California | -0.2092 | -0.0855 |
| Texas Christian | -0.1415 | -0.0777 |
| Arizona State | -0.2825 | -0.0773 |
| Texas | -0.1507 | -0.0767 |
| UC Irvine | -0.1782 | -0.0757 |
| Vanderbilt | -0.0651 | -0.0523 |
| Texas Tech | -0.1199 | -0.0506 |
| Texas A&M | -0.1558 | -0.0480 |
| UCLA | -0.1333 | -0.0479 |
| Pepperdine | -0.1409 | -0.0453 |
| San Diego | -0.0787 | -0.0297 |
| Cal Poly | -0.0671 | -0.0280 |
| Washington | -0.0806 | -0.0276 |
| Tulane | -0.0823 | -0.0215 |
| Mississippi State | -0.0625 | -0.0193 |
| Houston | -0.0274 | -0.0184 |
| California | -0.0488 | -0.0166 |
| UC Santa Barbara | -0.0542 | -0.0152 |
| Arkansas | -0.0421 | -0.0146 |
| Oklahoma | -0.0534 | -0.0133 |
| Mississippi | 0.0252 | -0.0129 |
This is actually kind of encouraging in a way. Stanford has been terribly treated by the selection process over the years (more on that in a minute), but that's the difference in an expectation of 1.45 championships and 1.82. Now, in some ways that is a big deal; championships are so rare that the difference in 1 and 2 is a big deal. Nonetheless, it's not like in a perfectly fair world Stanford would have run off a string like USC did in the early '70's or something, so we'll live with what we've got.
Since we've got this coin out, let's look at the other side of it. Who's benefited the most, since this is a zero-sum game?
| Team | Increased Probability of CWS Visits |
Increased Probability (in Championships) |
| Florida State | 0.5340 | 0.2570 |
| South Carolina | 0.3376 | 0.1520 |
| Miami, Florida | 0.4349 | 0.1517 |
| Florida | 0.3684 | 0.1340 |
| Louisiana State | 0.1360 | 0.1050 |
| Louisville | 0.2786 | 0.0863 |
| North Carolina | 0.1436 | 0.0853 |
| Clemson | 0.2167 | 0.0846 |
| Nebraska | 0.1935 | 0.0681 |
| Oregon State | 0.0503 | 0.0530 |
| Georgia Tech | 0.1262 | 0.0528 |
| Alabama | 0.1562 | 0.0527 |
| Rice | 0.0886 | 0.0517 |
| Virginia | 0.1018 | 0.0465 |
| Georgia | 0.1389 | 0.0409 |
| Wake Forest | 0.0942 | 0.0283 |
| East Carolina | 0.0851 | 0.0196 |
| Coastal Carolina | 0.0497 | 0.0160 |
| North Carolina State | 0.0438 | 0.0135 |
| Indiana | 0.0215 | 0.0089 |
| Missouri | 0.0197 | 0.0070 |
| Missouri State | 0.0181 | 0.0064 |
| Wichita State | 0.0340 | 0.0063 |
| Baylor | 0.0157 | 0.0062 |
| Oregon | 0.0210 | 0.0046 |
Florida State's been quite good and, as you can see up on the most consistent list, quite consistent, but they have benefited from a bunch of favorable placements, both in terms of sometimes being overseeded themselves and often given overseeded #2 matchups at home.
To localize this and enable us to get a little better context, here are the worst cases within five-year periods:
| Team | Years | Overlapping Years |
Reduced Probability (in Championships) |
| Stanford | 1999-2003 | 0.2036 | |
| Stanford | 2000-2004 | 0.1840 | |
| Stanford | 2001-2005 | 0.1564 | |
| Stanford | 2002-2006 | 0.1204 | |
| Stanford | 2008-2012 | 0.0852 | |
| Stanford | 2004-2008 | 0.0746 | |
| Cal State Fullerton | 2010-2014 | 0.0833 | |
| Cal State Fullerton | 2009-2013 | 0.0694 | |
| Cal State Fullerton | 2011-2015 | 0.0665 | |
| Vanderbilt | 2014-2018 | 0.0764 | |
| Vanderbilt | 2013-2017 | 0.0746 | |
| Vanderbilt | 2012-2016 | 0.0682 | |
| Vanderbilt | 2011-2015 | 0.0662 | |
| UCLA | 2009-2013 | 0.0748 | |
| UCLA | 2010-2014 | 0.0748 | |
| Arizona State | 2011-2015 | 0.0732 | |
| UC Irvine | 2007-2011 | 0.0715 | |
| UC Irvine | 2006-2010 | 0.0702 | |
| UC Irvine | 2005-2009 | 0.0697 | |
| Oregon State | 2006-2010 | 0.0673 | |
| Oregon State | 2005-2009 | 0.0636 | |
| Southern California | 2003-2007 | 0.0636 | |
| Long Beach State | 2001-2005 | 0.0636 | |
| Long Beach State | 2004-2008 | 0.0632 |
As you see, about 2/3 of Stanford's damage occurs in that early five-year period. That highlights one of the key things that gets overlooked a lot of times; when you mis-seed a team, it doesn't just affect them, it affects everyone who ends up in their path. This can be "positive" - one of the reasons that FSU is at the top of the benefitted list up there is that they got a lot of overseeded #2 seeds over the years, as I said - or it can be negative. Here are the years 1999-2003 for Stanford:
Every team in the table could have similar exercises, but Stanford really illustrates the truth that a top team, more or less recognized as such, can actually accumulate more damage over time, just because they're in position to be hurt by the misplacement of teams with short-term success. That 2003 placement, for example, was even worse for Riverside, obviously, but they don't get the cumulative effects. On the other hand, you could argue that it stunted their growth, so to speak, so I can't say which is actually more damaging in the long run.
Since I brought up the topic of the toughest regionals, here's that list - the 10 toughest regional fields of the 64-team era:
| Year | #1 Seed | #1 ISR | #2 Seed | #2 ISR | #3 Seed | #3 ISR | #4 Seed | #4 ISR | ISR Sum |
| 2008 | Long Beach State | 8 | San Diego | 6 | California | 10 | Fresno State | 25 | 480.9 |
| 2002 | Stanford | 2 | Long Beach State | 12 | San Jose State | 20 | Cal State Fullerton | 16 | 478.1 |
| 2000 | Stanford | 2 | Alabama | 19 | Nevada | 25 | Fresno State | 22 | 474.6 |
| 2010 | UCLA | 2 | Louisiana State | 27 | UC Irvine | 20 | Kent State | 95 | 473.8 |
| 2008 | Stanford | 4 | Pepperdine | 14 | Arkansas | 53 | UC Davis | 16 | 471.5 |
| 2001 | Southern California | 3 | Pepperdine | 7 | Fresno State | 29 | Oral Roberts | 51 | 471.1 |
| 2019 | Stanford | 4 | UC Santa Barbara | 10 | Fresno State | 13 | Sacramento State | 101 | 470.0 |
| 1999 | Stanford | 3 | Nevada | 16 | North Carolina | 33 | Loyola Marymount | 55 | 466.4 |
| 2003 | Long Beach State | 6 | Minnesota | 33 | Washington | 13 | Pepperdine | 35 | 466.3 |
And the 10 weakest ones:
| Year | #1 Seed | #1 ISR | #2 Seed | #2 ISR | #3 Seed | #3 ISR | #4 Seed | #4 ISR | ISR Sum |
| 2000 | Miami, Florida | 29 | Florida Atlantic | 44 | Florida International | 52 | Wagner | 256 | 417.6 |
| 2008 | Louisiana State | 20 | Southern Mississippi | 41 | New Orleans | 60 | Texas Southern | 289 | 418.2 |
| 2015 | Texas Christian | 4 | North Carolina State | 26 | Stony Brook | 112 | Sacred Heart | 264 | 425.5 |
| 2001 | Mississippi State | 34 | Ohio State | 76 | Delaware | 79 | Kent | 154 | 425.5 |
| 2008 | North Carolina | 9 | North Carolina-Wilmington | 56 | Elon | 65 | Mount St. Mary's | 262 | 426.0 |
| 2006 | Virginia | 24 | South Carolina | 40 | Evansville | 73 | Lehigh | 227 | 426.0 |
| 2001 | East Carolina | 16 | Winthrop | 45 | South Florida | 69 | Maryland-Baltimore County | 212 | 427.0 |
| 2017 | Louisiana State | 6 | Southeastern Louisiana | 41 | Rice | 59 | Texas Southern | 274 | 428.5 |
| 2012 | North Carolina State | 14 | Vanderbilt | 28 | North Carolina-Wilmington | 73 | Sacred Heart | 241 | 429.3 |
| 2001 | Florida State | 15 | Auburn | 18 | Jacksonville | 80 | Bethune-Cookman | 223 | 429.3 |
Let's try to close this section out with a fully analytical look at how the "selection committee's" performance has moved over the years. The reason for the quotes, of course, is that the committee is an everchanging set of shifting members, presumably guided by rules, tradition, and some occasional behind-the-scenes guidance from NCAA staff. What we're really looking at is how well the system as a whole has worked in identifying the postseason field. If we take the error measuring methodology referenced above - the difference in each team's probability of winning it all with a perfectly selected field and that team's probability of winning the actual field - and sum up the errors for all teams who were or should have been in a particular field, we get a reasonable measure of the quality of the selected field, with low scores being better:
|
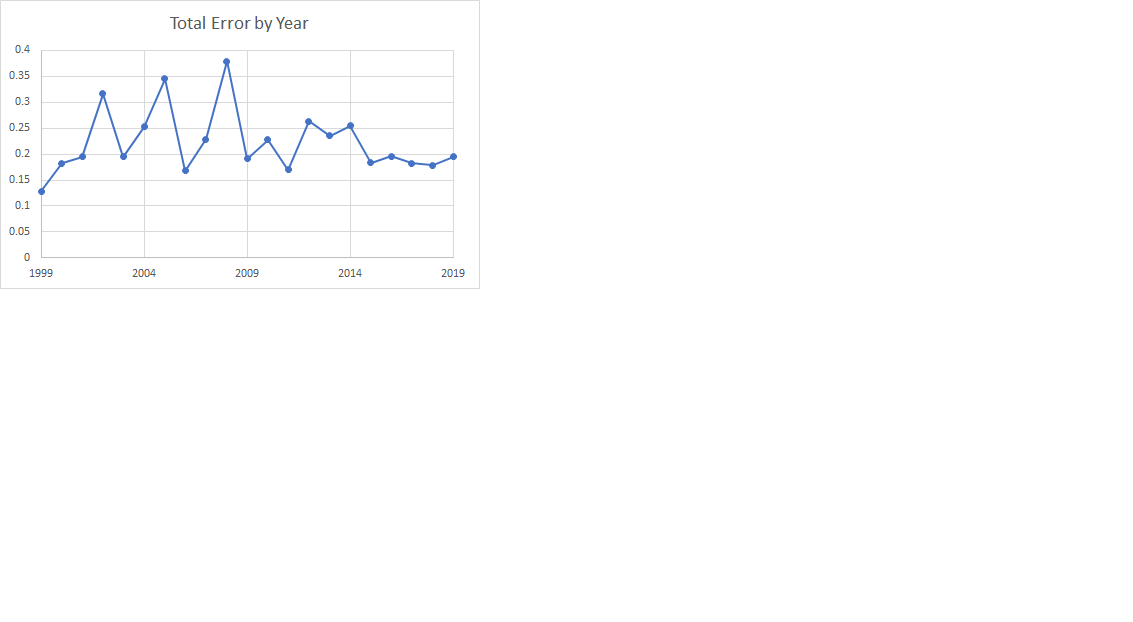 |
The data is uneven (and it's really odd that that first field in 1999 looks like the best to date), but it looks like there's been some improvement in recent years. There are still improvements to be made, since that error is not evenly distributed, but we appear to be headed in the right direction.
So far in this section, I've focused on the probability of winning the tournament. That's the thing that everybody focuses on (and it's kind of the point, I suppose), but there's another aspect, that of cases of teams being unfairly left out (and the obligatory flip side of teams being unfairly included). Most of the time, this has minimal impact on the chances of winning the whole thing, but there is potentially an impact on program growth for these teams - getting into the postseason adds at least another week of allowed practice and could have recruiting value. Using our ISR-perfect field as a reference guide, here are the teams that have been most often left out in the last 21 years:
| Team | Times Omitted |
| Cal Poly | 6 |
| Washington | 6 |
| Arizona | 6 |
| California | 6 |
| Gonzaga | 5 |
| Southern California | 5 |
| Stanford | 4 |
| UC Riverside | 4 |
| San Diego | 4 |
| UC Irvine | 4 |
| Oregon State | 4 |
| Kentucky | 3 |
| Missouri | 3 |
| Northwestern State | 3 |
| Mississippi | 3 |
| Brigham Young | 3 |
And here's that flip side:
| Team | Unearned Bids |
| St. John's | 6 |
| Florida Atlantic | 5 |
| East Carolina | 4 |
| North Carolina-Wilmington | 4 |
| Rutgers | 4 |
| Jacksonville | 4 |
| Stetson | 4 |
| Minnesota | 3 |
| North Carolina State | 3 |
| North Carolina | 3 |
| Middle Tennessee State | 3 |
| Louisiana-Lafayette | 3 |
| South Florida | 3 |
| Missouri | 3 |
| Ohio State | 3 |
| Oral Roberts | 3 |
| Tulane | 3 |
| Auburn | 3 |
| Nebraska | 3 |
| Florida International | 3 |
| Mississippi | 3 |
| Clemson | 3 |
Notice that oddly enough, Ole Miss and Missouri make both lists. I think that illustrates a weird thing about the SEC - on the one hand, they do get a boost a lot of times from the RPI inequities, so there are years when there are only six or seven deserving teams but eight get in. On the other hand, there are years when there are up to eleven legitimately deserving teams, and that leads to deserving teams getting out. It's an odd seesaw.
Postseason Results
When I made my list of things to study, best team without a title was on the list. Then I got ready to code it up and realized I already had the list of "best" teams up there, and it was kind of a silly problem. It's a weird coincidence that Stanford hasn't won one, even with the abuse we talked about above. Mostly, that comes down to losing the two coin toss games in 2000 and 2001; they were slight favorites both years, so that was just bad luck. Florida State is in a similar phase - for all that the narrative about Mike Martin's career talks about him never winning the big one, even discounting the favorable treatment they got from the committee, they were the third best team overall. If you flip that coin the other way in '99, he gets to retire as a championship-winning coach. Add in Arizona State, and we have a great illustration of the point I was making earlier about the inherent unreliability of postseason formats - three of the top five never won.
So, let's look at which years actually produced the strongest fields in Omaha. For all that we all love the story of Stony Brook going into Baton Rouge and coming out alive, the game is not interconnected enough that I wouldn't trade that for a tournament that has the best 8 teams in the country in it. Anyway, here's the total ISR for the 25 CWS fields:
| # | Year | Total ISR |
| 1 | 1995 | 1016.4 |
| 2 | 2010 | 1001.9 |
| 3 | 1996 | 998.8 |
| 4 | 2011 | 991.0 |
| 5 | 2013 | 989.4 |
| 6 | 1997 | 984.0 |
| 7 | 1999 | 980.1 |
| 8 | 2001 | 978.4 |
| 9 | 2009 | 978.0 |
| 10 | 1998 | 971.9 |
| 11 | 2004 | 971.1 |
| 12 | 2002 | 971.0 |
| 13 | 2006 | 970.8 |
| 14 | 2019 | 970.7 |
| 15 | 2000 | 968.7 |
| 16 | 2017 | 968.6 |
| 17 | 2005 | 967.0 |
| 18 | 2016 | 966.2 |
| 19 | 2003 | 965.5 |
| 20 | 2012 | 962.2 |
| 21 | 2018 | 960.7 |
| 22 | 2015 | 960.3 |
| 23 | 2008 | 958.6 |
| 24 | 2007 | 955.5 |
| 25 | 2014 | 955.2 |
I'm a bit flabbergasted. My memory of the days of the six-team regional were that they were fun, wild, chaotic affairs where the best team never won. Because of that, I'm amazed to find 1995, 1996, and 1997 all at or near the top of this list. '95 is anchored by that very strong Fullerton team, but 6 of the 8 #1 seeds won their regional.
It's possible but unprovable that there's some Stephen Jay Gould-style evidence in place that this supports the strengthening of the game overall. In general, stronger, more competitive sports have more teams that are capable of winning championships (or regionals or whatever), which leads to lower expectations for the best teams. The comparison between the men's and women's World Cups in soccer is an obvious example of this; it's wonderful that the US women are so dominant from our point of view, but the men have a stronger overall sport so that even Germany doesn't reach nearly the same level of dominance. Parenthetically, this is a cause of concern for Major League Baseball, because the number of teams winning 103+ games in the last 20 years is out of line with historical norms and may be a sign of overall decay in the sport rather than strength.
There are two ways that this is relevant. Note that I never actually said that the 1995 Fullerton team was the best of the last 25 years; I said they were the most dominant. Just by observation and memory, I have no idea how the 1995 Fullerton team would have done against the 2019 Vanderbilt champs, but I'm completely certain that the 2019 Indiana team (#40 in the ISR) would have won the bulk of their games against the 1995 Jacksonville team (also #40). The game as a whole has gotten stronger.
One last question about the postseason results: How have the national champs looked in the ISR - how good a team does the system usually manage to get to the championship?
| ISR Rank | # of Champs at End of Season |
# of Champs on Selection Date |
| 1 | 7 | 2 |
| 2 | 2 | 4 |
| 3 | 4 | 2 |
| 4 | 4 | 2 |
| 5 | 1 | 2 |
| 6 | 1 | 0 |
| 7 | 2 | 3 |
| 8 | 1 | 1 |
| 9 | 1 | 1 |
| 10 | 0 | 1 |
| 11 | 0 | 1 |
| 12 | 0 | 1 |
| 14 | 1 | 1 |
| 16 | 0 | 1 |
| 18 | 0 | 1 |
| 25 | 1 | 0 |
| 34 | 0 | 1 |
| 47 | 0 | 1 |
Few of the champions have been really bad, so there's that - adding in a month of success under mostly different conditions from the real season (remember that you can win the CWS with two pitchers, for example) boosts them all up quite a bit. All of them belonged in the tournament, at least. Eyeballing the individual years, it looks like having lots of postseason experience at the program level helps - besides that Fresno team in 2008, Virginia jumped from #34 to #14 in their title year, far from their best team, and all of the teams that started in the teens and ended up winning were Omaha perennials with the exception of Oregon State in 2007, who had been the best team in 2005 and won the title in 2006. I don't know that there are enough data points here to be significant in regards to any specific rankings, but it could be significant that the only two teams to be #1 in the regular season and win it all were in 1995 and 1997.
Miscellaneous
So, what else do we want to look at? How about one of those perennial questions: What were the biggest upsets of the last 25 years?
| # | ISR Difference |
Winner | Loser | Year | Date |
| 1 | 43.2 | Coppin State | George Mason | 2012 | 4/25 |
| 2 | 41.7 | Alabama A&M | Oklahoma State | 2010 | 3/23 |
| 3 | 39.3 | LIU-Brooklyn | Georgia | 2019 | 2/26 |
| 4 | 39.0 | Air Force | Texas Christian | 2010 | 3/26 |
| 5 | 39.0 | Air Force | Texas Christian | 2010 | 5/15 |
| 6 | 37.7 | New Orleans | Louisiana-Lafayette | 2014 | 4/08 |
| 7 | 36.9 | Maryland-Baltimore County | Tulane | 2012 | 3/24 |
| 8 | 36.0 | Southern | South Alabama | 2016 | 4/22 |
| 9 | 35.6 | Mount St. Mary's | Central Florida | 2011 | 3/08 |
| 10 | 35.5 | Mount St. Mary's | Maryland | 2013 | 4/17 |
| 11 | 35.2 | Charleston Southern | Florida | 2010 | 3/14 |
| 12 | 35.1 | Dayton | Louisiana State | 1996 | 3/13 |
| 13 | 35.1 | Texas Southern | Rice | 2004 | 6/04 |
| 14 | 35.1 | Tennessee-Martin | Missouri State | 2015 | 4/17 |
| 15 | 35.0 | Campbell | North Carolina | 2007 | 4/17 |
| 16 | 34.9 | Tennessee-Martin | Tennessee Tech | 2018 | 3/10 |
| 17 | 34.7 | North Carolina-Asheville | North Carolina | 2016 | 4/06 |
| 18 | 34.0 | Georgetown | James Madison | 1995 | 1/01 |
| 19 | 34.0 | Coppin State | Pittsburgh | 2013 | 4/17 |
| 20 | 33.9 | Eastern Kentucky | Alabama | 1996 | 3/20 |
| 21 | 33.9 | Oakland | Oklahoma State | 2014 | 2/22 |
| 22 | 33.7 | Chicago State | Pepperdine | 2009 | 3/21 |
| 23 | 33.5 | Boston University | Northeastern | 1995 | 1/01 |
| 24 | 33.3 | Fordham | Miami, Florida | 2010 | 3/16 |
| 25 | 33.3 | Houston Baptist | Texas Christian | 2011 | 3/12 |
Of this list, only the 2004 Texas Southern-Rice game is the only one to take place in the postseason. That's our UMBC-Virginia.
How about the best matchup games? Well, it turns out that that's not a very interesting list, because the only way to do it analytically is to combine the two ISR's in some fashion, and that 1995 Fullerton ISR basically swamps out anything else so that it just ends up being a list of their series from that year with a few others (most of them involving ASU in 2010) thrown in. I'll work on a better way to identify these.
This next miscellaneous table gives away one of the reasons for the better connectivity that we talked about back up a ways. It used to be routine for D1 teams, even power conference teams, to play mid-week games against teams from outside D1. They weren't always competitive - I've sat through more than my fair share of Mississippi State-Livingston (before they renamed it) games and don't really miss them - but they weren't really any worse than the average early-season game with a NEC team seeing the sun for the first time. That's gone now, as these numbers show (I don't have full scores for non-D1 games for 1998:
| Year | D1 Teams | Non-D1 Games per D1 Team |
Total Games | Wins by Non-D1 |
Losses by Non-D1 |
| 1995 | 276 | 4.3 | 1192 | 402 | 790 |
| 1996 | 275 | 4.1 | 1117 | 381 | 736 |
| 1997 | 273 | 4.2 | 1136 | 394 | 742 |
| 1999 | 278 | 4.3 | 1204 | 478 | 726 |
| 2000 | 282 | 3.7 | 1034 | 380 | 654 |
| 2001 | 282 | 3.8 | 1084 | 400 | 684 |
| 2002 | 286 | 3.0 | 863 | 287 | 576 |
| 2003 | 286 | 2.7 | 777 | 292 | 485 |
| 2004 | 287 | 2.4 | 701 | 259 | 442 |
| 2005 | 290 | 2.1 | 602 | 187 | 415 |
| 2006 | 293 | 1.8 | 540 | 161 | 379 |
| 2007 | 293 | 1.9 | 556 | 167 | 389 |
| 2008 | 296 | 2.1 | 610 | 175 | 435 |
| 2009 | 302 | 1.7 | 525 | 126 | 399 |
| 2010 | 301 | 1.8 | 546 | 161 | 385 |
| 2011 | 296 | 2.2 | 658 | 203 | 455 |
| 2012 | 297 | 1.1 | 329 | 105 | 224 |
| 2013 | 298 | 1.1 | 336 | 109 | 227 |
| 2014 | 297 | 1.8 | 547 | 216 | 331 |
| 2015 | 298 | 1.3 | 378 | 125 | 253 |
| 2016 | 300 | 0.6 | 178 | 37 | 141 |
| 2017 | 299 | 0.3 | 94 | 14 | 80 |
| 2018 | 297 | 0.3 | 102 | 18 | 84 |
| 2019 | 299 | 0.3 | 95 | 14 | 81 |
The interesting thing about this is that this behavior is actually counter to most teams' best interests. Since the first four games outside of D1 are just ignored by the RPI, you're actually better off picking up a midweek game against one of those rather than play a D1 opponent with a sub-.300 winning percentage (and might get more challenging opposition besides).
Next, the most basic counter of them all - what's the average number of runs scored per team per game?
| Year | Runs per Game per Team |
| 1995 | 6.07 |
| 1996 | 6.34 |
| 1997 | 6.88 |
| 1998 | 6.96 |
| 1999 | 6.82 |
| 2000 | 6.45 |
| 2001 | 6.34 |
| 2002 | 6.36 |
| 2003 | 6.05 |
| 2004 | 6.15 |
| 2005 | 6.07 |
| 2006 | 6.09 |
| 2007 | 6.03 |
| 2008 | 6.47 |
| 2009 | 6.77 |
| 2010 | 6.90 |
| 2011 | 5.54 |
| 2012 | 5.33 |
| 2013 | 5.24 |
| 2014 | 5.04 |
| 2015 | 5.40 |
| 2016 | 5.52 |
| 2017 | 5.69 |
| 2018 | 5.62 |
| 2019 | 5.82 |
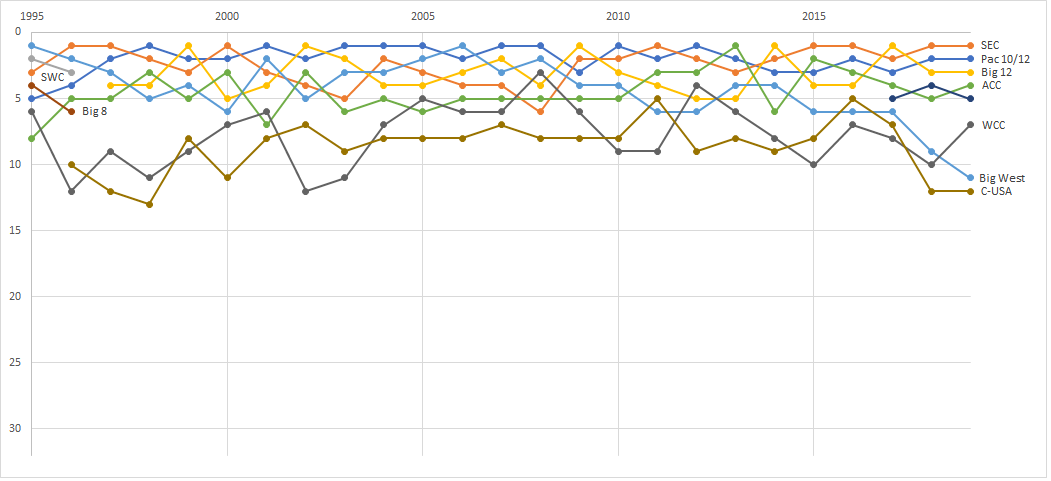
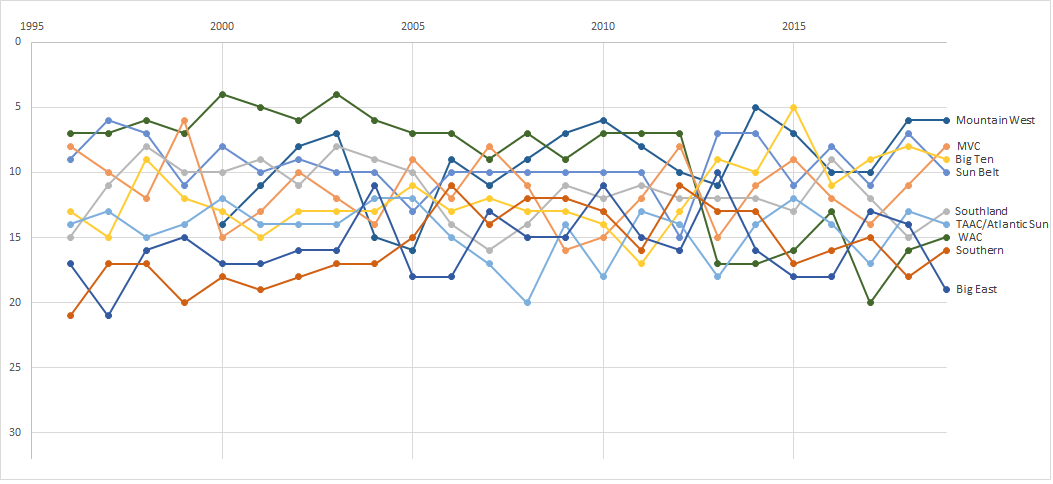
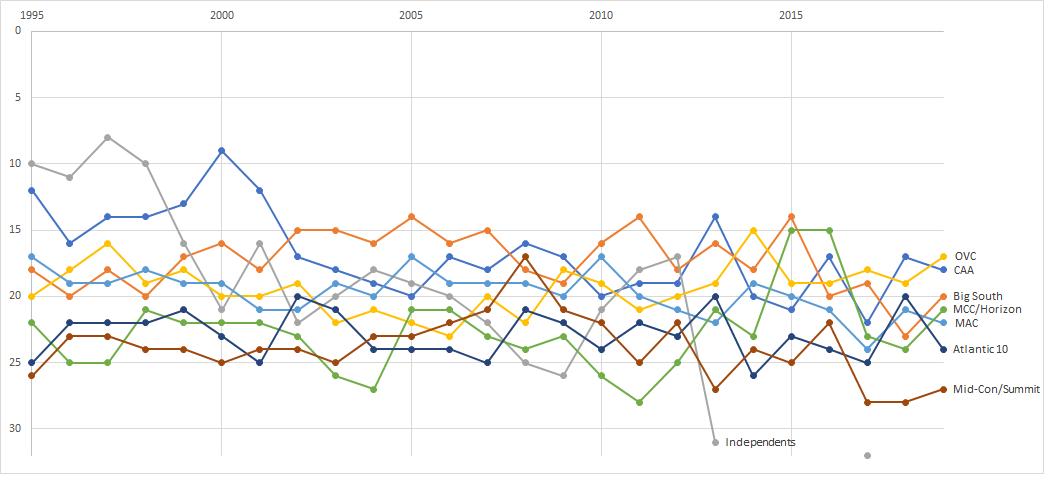
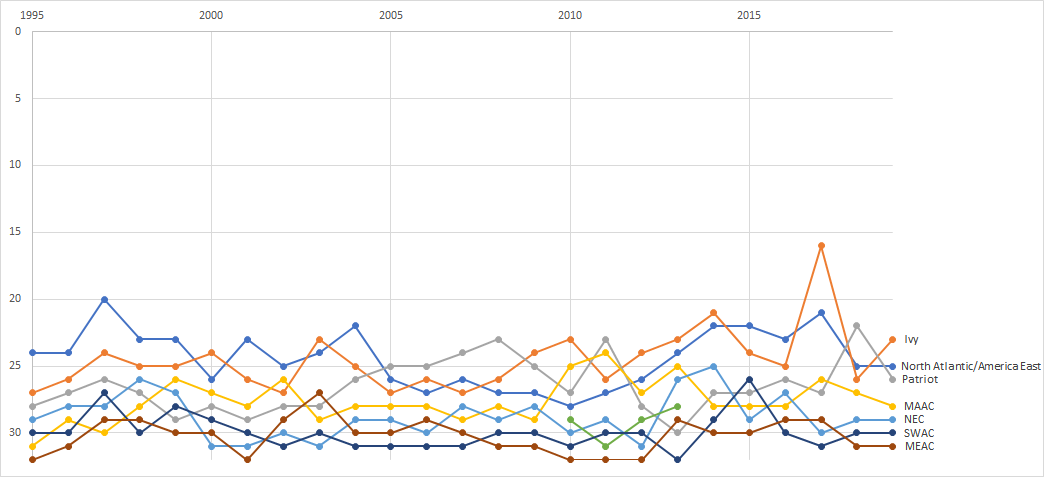
Now, we'll close out with some big, gnarled pictures. I don't pay that much attention to conference-based analysis, just because I don't find that it answers that many questions that aren't better answered in other ways (and, to be honest, I find the conference pride thing a bit weird). However, I know that there are those of you to whom it matters, so this series has the path of each conference over the years in terms of their conference ISR rank for the year. The lines that are most interesting to me in terms of what they say about how the game is structured are those for the WAC/Mountain West, the ACC, and the independents.
| Boyd's World-> A 25-Year Retrospective -- 1995-2019 | About the author, Boyd Nation |