| Boyd's World-> Breadcrumbs Back to Omaha-> The Shape of a Championship | About the author, Boyd Nation |
Publication Date: May 13, 2003
Interesting Diversions
Before I get to my main topic this week, there are a couple of interesting news items worth paying attention to. First of all, the big story in all of college sports this week is the potential for ACC expansion and the resulting domino effect that would ripple through college athletics for the next decade. It's way too early in the process to start looking at the effect on baseball, although that may be an interesting off-season topic, but it's worth keeping an eye on.
In a quieter but much more narrowly focused story, it was discovered this week that New Mexico has scheduled more games than the legal 56-game limit, which is not unusual, and had failed to cancel any of them when they had unusually good weather, which is unusual. The story behind this one is mildly interesting, as the discovery was actually made by college baseball score collector and superfan Rick Rollins, who called the school and the Mountain West office seeking clarification on which of the exceptions to the rule allowed this schedule and discovered that the school had been asleep at the wheel. Based on statements from the conference office, it appears that the team is going forward with this weekend's series at San Diego State, (which makes helpful rainouts unlikely), and that the most likely punishment is that they will be required to shorten next year's schedule. No mention has been made by either the school or the conference office of the limits on individual player games, which may require the Lobos to play short-handed this weekend.
What makes all of this especially relevant is that this distraction comes at a time when New Mexico is on the bubble to qualify for the NCAA tournament for the first time since 1962. They've fallen to #62 in the RPI this week, but they're currently second in a relatively strong conference this year, and a conference tournament win or at-large bid is not at all out of the question.
What Does That Look Like?
I'm sticking a toe in some new water this week. The site has always been almost strictly text and numbers. That hasn't really been a conscious decision, other than a strong aversion to most of what the Web has become -- a large amount of wasted bandwidth used on pointless graphical content, which surrounds some of the most useful actual content that's ever been made available to the public at large. My own talents almost completely lack any artistic skill, but I do have a reasonable bit of background in visual presentation of information; I'm headed to an Edward Tufte course next month, and I've been reviewing some of his books, which triggered the thoughts for this column. OK, enough background. What does the shape of a championship season look like?
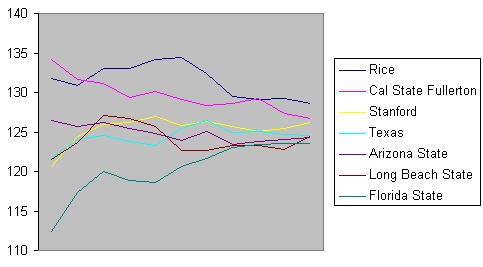
Realistically, there are seven contenders for the national championship. Usually, I would say there were five, since it's extremely rare for a team outside the top 5 to win it all, and we're late enough in the season that the ISR top 5 almost certainly has the nation's best team in it. However, there's a certain type of schedule that's hard to rank, so I'm going to make a couple of exceptions this time. I refer to that type of schedule as a Miami schedule, in honor of the 1999 Hurricanes, but this year's best example is actually in Tallahassee. Essentially, if you've checked out the probability work I've done, for a top 10 team, there's not much difference in playing #150 and playing #225; you're going to win 99% of the time against either. There's a circular problem, though, because for that #225 team, they're not much more likely to beat #75 as they are #5, and that means that games against them provides almost no information about how good the favorite actually is. In short, when almost a third of your schedule is played against VMI, Evansville, Maryland, Charleston Southern, Appalachian State, St. Joseph's, and Siena, we have no idea how good you are. Therefore, Florida State could actually be the best team in the country, and they could be the tenth best. Because of that, I'm declaring them to be a contender until proven otherwise. Their schedule is less extreme, but the six games against Hawaii-Hilo make judging Arizona State a bit risky as well, so here they are.
Now, those seven teams have followed different routes to the top or near it. Fullerton came out incredibly hot, suffered through a rough patch (albeit one with a cause -- Wes Littleton's suspension -- which may or may not be significant), and then got better. Rice started out OK, got incredibly hot, and then struggled with no apparent cause (although pitcher workload is always a concern for them). Stanford started out tepid and has steadily improved their standing. Here's a graphical look at the ISR progression of each team as the season has progressed:
Now, it would be interesting to know if one of these shapes better represents a team looking to become a champion. The #1 ISR team through the regular season has never won a national championship (the ISR dates back to 1998 so far). This could just be coincidence, and it could be that early season excellence leads to some sort of fatigue, physical or mental. Most teams have bad patches, so it might be that how those are handled is a better indicator. In hopes of some sort of pattern, let's look at the shapes for the last five NCAA champions:
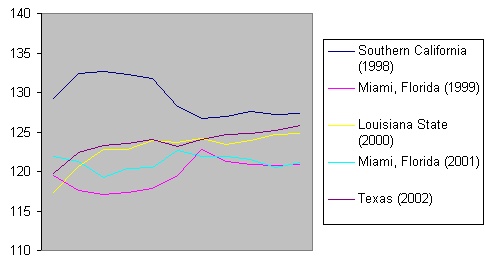
Is there a definitive answer? No, not really. USC's 1998 win really doesn't fit with the other lines; it may be that the last year of the 48-team tournament ties in there. The other four really pair up well to the two big conference teams and the two Miami wins; that may tie in well to the aforementioned problems with judging the schedule. The best predictor I can find here is fairly weak, but you could make a good case for Stanford being a favorite this year based on the LSU-Texas pair. Neither Florida State nor Arizona State this year appear to really be matching the Miami model all that well.
Five years is really not enough time to get a good feel for how this is going to work, if it works at all. One of my planned offseason projects for this year involves beginning to use the mountain of media guides on my desk to recreate past seasons; it'll be interesting to go back and see if a pattern emerges once we have, say, twenty-five years of data to look at.
Pitch Count Watch
Rather than keep returning to the subject of pitch counts and pitcher usage in general too often for my main theme, I'm just going to run a standard feature down here where I point out potential problems; feel free to stop reading above this if the subject doesn't interest you. This will just be a quick listing of questionable starts that have caught my eye -- the general threshold for listing is 120 actual pitches or 130 estimated, although short rest will also get a pitcher listed if I catch it. Don't blame me; I'm just the messenger.
| Date | Team | Pitcher | Opponent | IP | H | R | ER | BB | SO | AB | BF | Pitches | ||||||||||||
| Apr 4 | Samford | Stephen Artz | Troy State | 8.0 | 13 | 5 | 5 | 3 | 6 | 35 | 39 | 119 | ||||||||||||
| May 9 | Kansas | Kevin Wheeler | Texas A&M | 9.1 | 11 | 4 | 4 | 1 | 1 | 38 | 42 | 147 (*) | ||||||||||||
| May 9 | Southern Mississippi | Bob McCrory | South Florida | 7.1 | 6 | 1 | 1 | 5 | 6 | 26 | 31 | 127 | ||||||||||||
| May 9 | Eastern Michigan | Dave Pieron | Northern Illinois | 9.0 | 16 | 6 | 6 | 2 | 5 | 41 | 44 | 154 (*) | ||||||||||||
| May 9 | Ohio | Shaun Peet | Toledo | 8.0 | 10 | 5 | 5 | 3 | 6 | 34 | 38 | 149 (*) | ||||||||||||
| May 9 | Toledo | J. R. Duffey | Ohio | 8.1 | 8 | 5 | 5 | 4 | 4 | 33 | 39 | 148 (*) | ||||||||||||
| May 9 | Mississippi | T. J. Beam | Florida | 7.0 | 2 | 0 | 0 | 4 | 8 | 22 | 27 | 123 | ||||||||||||
| May 9 | East Tennessee State | Tim Turner | Furman | 8.1 | 10 | 3 | 2 | 3 | 7 | 34 | 39 | 149 (*) | ||||||||||||
| May 10 | Dayton | Tim Miller | George Washington | 7.0 | 8 | 4 | 4 | 4 | 8 | 28 | 33 | 127 | ||||||||||||
| May 10 | Boston College | Chris Lambert | St. John's | 7.0 | 6 | 2 | 2 | 5 | 5 | 24 | 30 | 125 | ||||||||||||
| May 10 | St. John's | A. Varvaro | Boston College | 9.0 | 5 | 0 | 0 | 4 | 7 | 33 | 39 | 132 | ||||||||||||
| May 10 | Winthrop | Kevin Slowey | High Point | 9.0 | 11 | 2 | 2 | 2 | 10 | 33 | 39 | 141 (*) | ||||||||||||
| May 10 | Hofstra | Kellen Taylor | Drexel | 9.0 | 5 | 2 | 1 | 5 | 3 | 29 | 36 | 130 (*) | ||||||||||||
| May 10 | Tulane | Cory Hahn | Louisville | 7.2 | 10 | 6 | 5 | 4 | 6 | 33 | 37 | 146 (*) | ||||||||||||
| May 10 | Rider | James Hoey | Manhattan | 11.0 | 6 | 1 | 1 | 4 | 9 | 35 | 43 | 145 (*) | ||||||||||||
| May 10 | Manhattan | Darcy | Rider | 11.0 | 7 | 1 | 0 | 1 | 11 | 41 | 42 | 155 (*) | ||||||||||||
| May 10 | Evansville | Mitch Prout | Northern Iowa | 8.0 | 12 | 9 | 8 | 4 | 4 | 35 | 41 | 136 | ||||||||||||
| May 10 | Utah | MacKay | Air Force | 7.0 | 8 | 5 | 3 | 5 | 9 | 29 | 35 | 132 | ||||||||||||
| May 10 | Murray State | Kyle Perry | Tennessee-Martin | 6.2 | 6 | 8 | 3 | 5 | 7 | 27 | 32 | 124 | ||||||||||||
| May 10 | Western Kentucky | Andy Baldwin | Arkansas-Little Rock | 9.0 | 8 | 4 | 4 | 4 | 6 | 31 | 37 | 134 (*) | ||||||||||||
| May 10 | Rice | Jeff Niemann | Nevada | 8.2 | 9 | 4 | 3 | 1 | 8 | 31 | 35 | 155 | ||||||||||||
| May 11 | Xavier | Adam Jahnsen | LaSalle | 7.0 | 4 | 2 | 2 | 6 | 3 | 24 | 31 | 129 | ||||||||||||
| May 11 | Jacksonville | Darren Truty | Miami, Florida | 7.1 | 6 | 3 | 2 | 2 | 6 | 26 | 28 | 132 | ||||||||||||
| May 11 | Kansas | Chris Smart | Texas A&M | 9.2 | 10 | 5 | 4 | 2 | 5 | 37 | 41 | 142 (*) | ||||||||||||
| May 11 | St. Louis | Corey Lawson | Cincinnati | 9.0 | 5 | 0 | 0 | 4 | 7 | 33 | 37 | 146 | ||||||||||||
| May 11 | Princeton | Thomas Pauly | Harvard | 9.0 | 4 | 2 | 2 | 7 | 10 | 29 | 36 | 142 (*) | ||||||||||||
| May 11 | Western Illinois | Shay Butler | Chicago State | 9.0 | 8 | 5 | 4 | 3 | 10 | 35 | 38 | 148 (*) | ||||||||||||
| May 11 | Fairleigh Dickinson | Gregg Pleeter | Maryland-Baltimore County | 9.0 | 8 | 5 | 5 | 5 | 11 | 36 | 41 | 160 (*) | ||||||||||||
| May 11 | Maryland-Baltimore County | Tom Ballenger | Fairleigh Dickinson | 8.0 | 8 | 1 | 1 | 3 | 10 | 31 | 35 | 146 (*) | ||||||||||||
| May 11 | Fairleigh Dickinson | Rich Franceschi | Maryland-Baltimore County | 7.0 | 12 | 10 | 8 | 6 | 3 | 34 | 41 | 153 (*) | ||||||||||||
| May 11 | Appalachian State | Taylor Craig | Western Carolina | 7.1 | 7 | 6 | 6 | 4 | 2 | 27 | 34 | 135 | ||||||||||||
| May 11 | Appalachian State | Scott Clark | Western Carolina | 7.0 | 10 | 5 | 5 | 6 | 3 | 28 | 35 | 142 | ||||||||||||
| May 11 | The Citadel | Chip Cannon | North Carolina-Greensboro | 9.0 | 10 | 6 | 5 | 4 | 4 | 38 | 42 | 140 | ||||||||||||
| May 12 | Appalachian State | Joe Norton | Western Carolina | 7.0 | 13 | 8 | 7 | 6 | 1 | 31 | 38 | 143 | ||||||||||||
| May 13 | Winthrop | Thomas Olejniczak | Mississippi State | 7.0 | 9 | 6 | 6 | 3 | 2 | 30 | 33 | 126 | ||||||||||||
| May 13 | Maryland-Baltimore County | Matt Farina | St. Francis | 9.0 | 10 | 1 | 1 | 3 | 5 | 35 | 38 | 143 (*) | ||||||||||||
| May 13 | Arkansas State | Kevin Cutler | Murray State | 9.0 | 6 | 3 | 3 | 2 | 11 | 32 | 34 | 120 | ||||||||||||
| May 13 | Oregon State | Jake Postlewait | Arizona State | 9.0 | 9 | 1 | 1 | 2 | 2 | 34 | 37 | 134 |
(*) Pitch count is estimated.
The Artz correction is based on an actual pitch count.
If you're interested in reprinting this or any other Boyd's World material for your publication or Web site, please read the reprint policy and contact me
| Boyd's World-> Breadcrumbs Back to Omaha-> The Shape of a Championship | About the author, Boyd Nation |