| Boyd's World-> Breadcrumbs Back to Omaha-> College Quality Starts? | About the author, Boyd Nation |
College Quality Starts?
Publication Date: July 24, 2007
You spend three decades searching for a better mousetrap, and it turns out that what people wanted was just better labels on the cheese or something. OK, I exaggerate, but if you think about he career of Bill James, he's produced all sorts of interesting, complicated metrics, but the one that probably gets referenced most is the one-off trivial notion of a quality start, the James-defined notion that a pitcher that goes six innings and gives up three runs or less has given his team a fair chance to win.
I've been playing lately with the notion of the demands that the starting pitcher puts on the rest of the team lately. When you get right down to it, that's a useful thought -- if the starter goes less than 9 innings, he's demanding outs from the bullpen, and if he gives up runs, he's demanding runs from the offense. Those two things turn out to be highly interrelated, so there's not a simple formula that combines them, but some of the gleanings along the way are interesting.
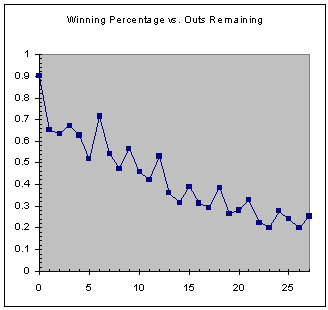
First of all, a couple of simple graphs. Here's the relationship between the outs remaining when the starter comes out and winning percentage:
Complete games are worth a lot by this standard, since the line curves up on that end, but conversely it's worth noting that there's a substantial penalty for having to pull the starter in the middle of an inning -- it's probably not worth it to gamble for the next inning unless you're fairly confident that your guy can make it through there.
Here's the similar chart for starter runs allowed against winning percentage:
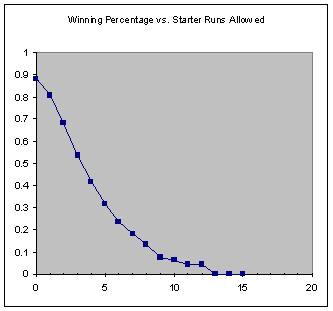
Those two lines are the two elements that you're always weighing in deciding whether that next inning is worth it -- does the cost of the potential runs allowed balance the benefit of another inning?
In searching for a college equivalent of a quality start, this next chart could be helpful. It's the winning percentage for the different IP/RA combinations around the breakeven point. All the winning percentages referenced in this column, by the way, are cumulative totals for the 2005-2007 seasons.
           IP
        5     6     7
R  2  .708  .686  .790
u  3  .570  .558  .650
n  4  .432  .448  .545
s  5  .344  .386  .390
Interestingly, even though the offensive environment is much higher for this data set than for the one when James invented the quality start, you can still make a pretty good case for the 6 inning, 3 run start as the defining point for your pitcher giving you a fair chance to win. Smart man, that Bill James.
Note that this data only reflects cases where the pitcher was actually pulled at this point. Some of the 6IP,3R starts went on to become 7IP,3R starts, increasing the chance for a win, but some went on to become 7IP,5R outings (or, even worse, 6.1IP,5R). Now, every game situation is more complicated than this, since obviously pitch counts, day of the week, and actual offensive contribution all can change the decision on the ground. In retrospect, though, know that if your starter gave you 6 and only gave them 3, it's not his fault.
If you're interested in reprinting this or any other Boyd's World material for your publication or Web site, please read the reprint policy and contact me
| Boyd's World-> Breadcrumbs Back to Omaha-> College Quality Starts? | About the author, Boyd Nation |